SHARE Hydro Feasibility Update, March 2022
Regular readers will remember earlier articles describing our initial investigations into the potential of water turbines. For the benefit of newer readers, those investigations involved installing a measurement weir structure, however this unfortunately came to a premature end when the Environment Agency took an active interest. Temporary measurement weirs are permitted, however in this instance the EA considered that expensive licences would be needed, and that special provisions would have to be put in place to enable eels and migrating fish to move upstream unhindered. To our knowledge, eels and migrating fish haven’t been seen in this tributary of the Lynher in living memory, however the possibility that Samantha Salmon might take a wrong turn and find her path obstructed was enough to keep the good folk at the EA awake at night. Also, the required licences were unaffordable, and so the measurement weir had to go.
The measurement weir, when fully up and running, would have enabled automatic 24/7 measurement of flow and data logging, and analysis in the comfort of a living room, with no need to visit the site other than to remove flotsam debris now and again. It was at the “heavy and sophisticated” end of the flow measurement technology spectrum, requiring some clever electronics and metalwork weighing the wrong side of 200 kg, and requiring mechanical handling equipment move to site and install!
The original intention of the measurement weir was to enable flow measurement to take place over a 12 months period, and so characterise the stream in terms of its generation potential throughout the year, and thus establish the financial feasibility of a turbo-generator installation in a stream of this sort of size. We still wanted to achieve this objective (but of course without giving the EA indigestion) and so we purchased a small inexpensive water flow speed measuring turbine, and have been using this to measure the stream flow weekly since the middle of November.
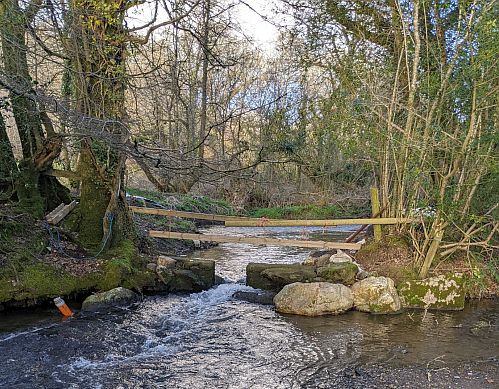
This picture shows the stream passing between concrete piers at the measurement site
 Not quite Pooh Sticks! This little turbine is almost at the other end of the technology spectrum, costing very little and weighing in at less than half a kilogram! Needless to say, this low tech solution requires a site visit to gather data, and “wandering down there once a week” falls somewhat short of “24/7” data measurement! However the little turbine works rather well, requires no on-site modifications or facilities, and the hill provides some good exercise! Accuracy is sufficient for our “feasibility assessment” needs, and the weekly data is slowly building into useful information.
These pictures show the jig used to space the flow measurements, the depth gauge and the little turbine at the bottom of the black and white stick

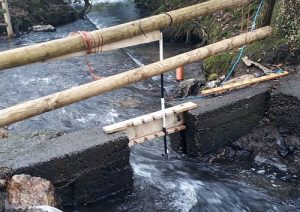
The piers are parallel and 0.6m apart. At each visit the depth of water between the piers is measured, as is the speed of flow on a matrix at 100mm apart. At a depth of 100mm from the bottom, 5 speed measurements are taken 100mm apart across the width between the piers. This is repeated at 200mm from the bottom and so on until the turbine is near the surface. It is then a simple calculation to calculate the volume of water flow. We convert this into potential electricity generation in Watts (or kW) using the following assumptions:
- That it will be possible to achieve a water “head” of 3m – i.e. the inlet to the turbine would be upstream relative to the outlet such that there is a vertical distance between of 3m
- That it would be permitted to divert only 50% of the stream flow through the water turbine
- That the turbo-generator efficiency would be circa 80%
Here is a summary of the measurements taken to date:
 Although it has seemed like the weather has been rather bad recently (with storms from Dudley to Gladys), there was in fact an unusually long dry period at the end of last year and the early part of this year. You can see in the table above that during this period there was very little flow – sometimes too little to measure. At other times the water level was well up the piers.
Some other observations:
- The flow rate reacts quickly to rainfall. The water level quickly rises, and fairly quickly drops soon after the rain ceases.
- Because of the above, and the reluctance of the measurer to wander down to the site in bad weather, we will likely be missing the peak flows. This may not matter so long as the data is gathered for a sufficiently long period.
- We can see already that when the stream is in spate a turbo-generator could produce more than 4kW continuously – around 100kWh each day. This is enough to power 10 homes.
- The average power to date is just over 2.5kW. No doubt significantly impacted by the long dry spell, but nevertheless indicating that it is unlikely that a stream of this size would be economically viable. A long wet spring and summer might change this assessment…..
The data that we have gathered so far enables us to plot the “water depth” in metres against “calculated power” in watts. The scatter plot below shows, as you would expect, that there is a good correlation.
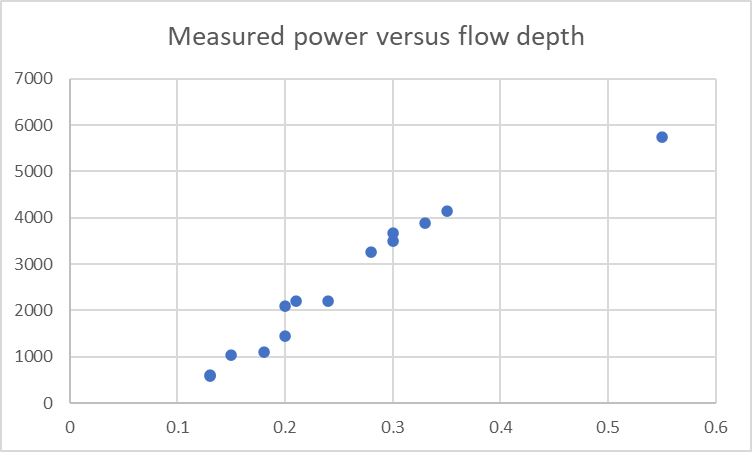 Over time, we hope more measurements will enable the chart to be better populated in the depth range 0.35 to 0.6m, but already we can see that for the water depths below 0.35m we can use the chart in lieu of measuring the flow – i.e we can just measure the depth of water.
Although still early days, we are gathering good data. The data will enable the original objectives to be achieved. While it is rather manually intensive, the small turbine works well at this location, due to the existence of the concrete piers, and reasonably coherent flow. Data gathering at another site might not be anything like so easy.
At the time that we have gathered sufficient data, we will provide a further update, and final conclusions.